Test driving a project should result in a test coverage of 100% of the code. But how can we know what test coverage we have? Is it even important?
Know what you measure
Numbers is a complicated subject. They are a little like alcohol. To much and dependant of them is a problem. None may be boring. The Swedish word 'lagom' is very applicable here. It means not to much and not to little, just enough.
To measure is to know
As an engineer I know that if you can't measure a value, you don't know anything about it. But measuring the wrong thing is just as bad. You must know what the values you get represents. If you don't, then you should at least not talk about them.
Is it important
Is test coverage even important? What is important is that you are certain that the functionality you want to support actually works as expected and required. Numbers are easy to misunderstand and test coverage test coverage can be useless if the tests are bad. Suppose that all code is executed but nothing is asserted? Then we might think that we have a great test coverage, but if nothing is asserted then it is actually worthless. So test coverage may be a good value to track, but it may also be totally useless information. The only way to know is to have confidence in the test code that actually generated the execution. A bad test will result in an execution that may or may not be correct.
But enough with ranting about numbers. How do you measure the test coverage? As usual, use the right tools for the job. One tool is Cobertura. It works great, but it has some problems when it comes to Maven projects with multiple modules.
Instrumented classes
Cobertura works like this: It instruments classes and writes to a log file each time a line is executed. The log is then combined with the source code to calculate which rows that actually were executed.
Let's start with the simple case that works out of the box.
The simple case - one Maven module
A simple example is when you have a simple project in one module. It is easy in this case to measure the test coverage using a Maven plugin.
The project I use in ths example looks like this:
one-module-example
|-- pom.xml
`-- src
    |-- main
    |   `-- java
    |       `-- se
    |           `-- sigma
    |               `-- calculator
    |                   `-- Calculator.java
    `-- test
        `-- java
            `-- se
                `-- sigma
                    `-- calculator
                        `-- CalculatorTest.java
We have a really simple calculator that calculates fibonacci numbers. The source looks like this:
src/main/java/se/sigma/calculator/Calculator.java
package se.sigma.calculator;

public class Calculator {
    public int nextFibonacci(int a, int b) {
        return a + b;
    }
}
The test code is also simple and looks like this:
src/test/java/se/sigma/calculator/CalculatorTest.java
package se.sigma.calculator;

import org.junit.Test;

import static org.hamcrest.core.Is.is;
import static org.junit.Assert.assertThat;

public class CalculatorTest {

    @Test
    public void shouldCalculateFibonacci() {
        Calculator calculator = new Calculator();
        int expected = 13;
        int actual = calculator.nextFibonacci(5, 8);

        assertThat(actual, is(expected));
    }
}
The test coverage is 100% and it can be measured using Cobertura as shown in the Maven Pom below:
pom.xml
<?xml version="1.0" encoding="UTF-8"?>
<project>
    <modelVersion>4.0.0</modelVersion>
    <groupId>se.thinkcode</groupId>
    <artifactId>one-module-example</artifactId>
    <version>1.0</version>
    <properties>
        <project.build.sourceEncoding>UTF-8</project.build.sourceEncoding>
        <project.reporting.outputEncoding>UTF-8</project.reporting.outputEncoding>
    </properties>
    <build>
        <plugins>
            <plugin>
                <groupId>org.codehaus.mojo</groupId>
                <artifactId>cobertura-maven-plugin</artifactId>
                <version>2.5.1</version>
                <executions>
                    <execution>
                        <phase>process-classes</phase>
                        <goals>
                            <goal>cobertura</goal>
                        </goals>
                    </execution>
                </executions>
            </plugin>
        </plugins>
    </build>
    <dependencies>
        <dependency>
            <groupId>junit</groupId>
            <artifactId>junit</artifactId>
            <version>4.10</version>
        </dependency>
    </dependencies>
</project>
The key part here is the cobertura-maven-plugin that is executed in the process-classes phase. It will
instrument the compiled classes so Cobertura can record the execution of each line.
The report from a build looks like this:

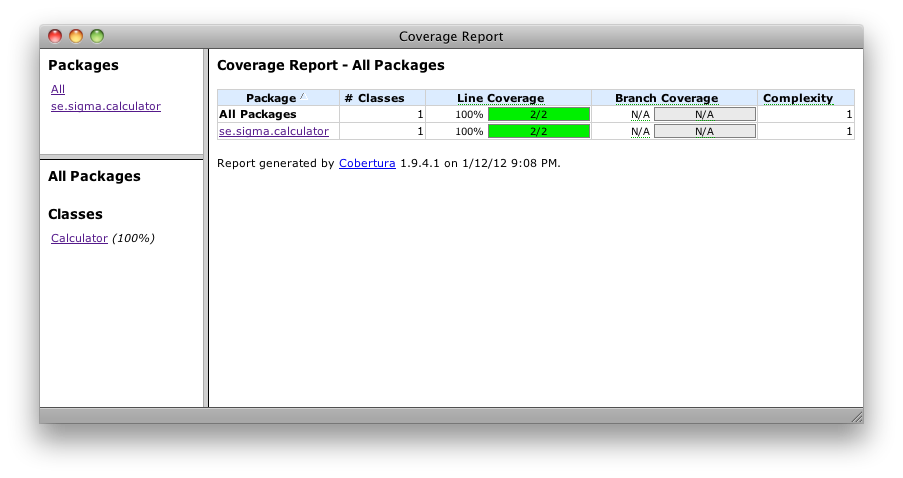
It tells us that we have 100% coverage of the system and that two out of two lines of code has been executed. We have the complexity 1. There is only one path through the code. There are no conditions that will give us a different paths of execution.
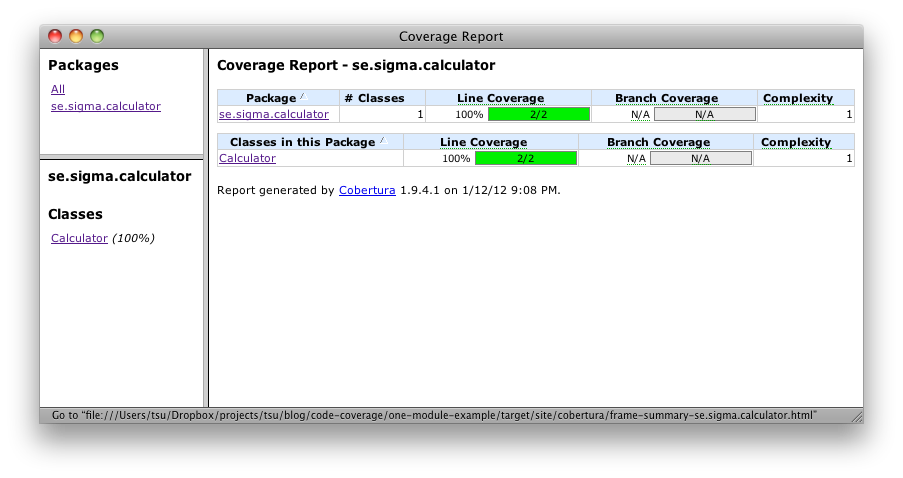
Drilling down into the package se.sigma.calculator will give you the view below:

Further drilling into the class Calculator will give you the view below:

We note that each executed line is counted and the number of times it has been executed is reported. This doesn't tell us anything about the quality of a test, it just tells us that the line has been executed. The quality of the tests has to be validated by examining the test cases themselves. I don't know of any good tool that will help you here. You must use your experience as developer and your domain knowledge about the domain problem to know if this is a good test that tests the correct things or not.
As a side effect, we are publishing a nice way to browse the source code.
This case was easy since it is just one Maven module. A multi module Maven project is trickier if the production code and test code test is defined in different modules. The reason lays in the design of Maven. Maven will execute all build steps for the entire module before moving on to the next module. This is the only reasonable way to design a tool like Maven, but it clashes somewhat with a measuring tool like Cobertura.
A more complicated case - multiple Maven modules
If we have tests defined in one module and the production code in another module then we will have a problem with the behaviour of Maven. It performs all it's build phases for each module before it continues with the next module. This is by design and normally a good thing.
Given a setup as below:
multi-module-failing-example
|-- pom.xml
|-- product
|   |-- pom.xml
|   `-- src
|       `-- main
|           `-- java
|               `-- se
|                   `-- sigma
|                       `-- calculator
|                           `-- Calculator.java
`-- test
    |-- pom.xml
    `-- src
        `-- test
            `-- java
                `-- se
                    `-- sigma
                        `-- calculator
                            `-- CalculatorTest.java
The production code and the test code is the same as before. A dependency has been added from the test module to the product so the Calculator can be found from the test. The only real difference is that I choose to separate production and test code in different Maven modules. The reasons for doing that may differ, in my cases I tend to have slow integration or acceptance test defined like this. It normally works very well, but test coverage is difficult to calculate using Maven.
I include the Maven poms for reference. They are the only thing that differs in this example compared to the first example.
The root pom is defined as:
pom.xml
<?xml version="1.0" encoding="UTF-8"?>
<project>
    <modelVersion>4.0.0</modelVersion>
    <groupId>se.thinkcode</groupId>
    <artifactId>multi-module-failing-example</artifactId>
    <version>1.0</version>
    <packaging>pom</packaging>
    <modules>
        <module>product</module>
        <module>test</module>
    </modules>
    <properties>
        <project.build.sourceEncoding>UTF-8</project.build.sourceEncoding>
        <project.reporting.outputEncoding>UTF-8</project.reporting.outputEncoding>
    </properties>
    <build>
        <plugins>
            <plugin>
                <groupId>org.codehaus.mojo</groupId>
                <artifactId>cobertura-maven-plugin</artifactId>
                <version>2.5.1</version>
                <executions>
                    <execution>
                        <phase>post-integration-test</phase>
                        <goals>
                            <goal>cobertura</goal>
                        </goals>
                    </execution>
                </executions>
            </plugin>
        </plugins>
    </build>
    <dependencies>
        <dependency>
            <groupId>junit</groupId>
            <artifactId>junit</artifactId>
            <version>4.10</version>
        </dependency>
    </dependencies>
</project>
It has the same cobertura-maven-plugin defined and a report is generated. It also refers to the two modules that contains the product and the test in it's modules section.
The product pom is defined as:
product/pom.xml
<?xml version="1.0" encoding="UTF-8"?>
<project>
    <modelVersion>4.0.0</modelVersion>
    <parent>
        <groupId>se.thinkcode</groupId>
        <artifactId>multi-module-failing-example</artifactId>
        <version>1.0</version>
    </parent>
    <groupId>se.thinkcode</groupId>
    <artifactId>calculator</artifactId>
    <version>1.0</version>
</project>
The test pom is defined as below:
test/pom.xml
<?xml version="1.0" encoding="UTF-8"?>
<project>
    <modelVersion>4.0.0</modelVersion>
    <parent>
        <groupId>se.thinkcode</groupId>
        <artifactId>multi-module-failing-example</artifactId>
        <version>1.0</version>
    </parent>
    <groupId>se.thinkcode</groupId>
    <artifactId>calculator-test</artifactId>
    <version>1.0</version>
    <dependencies>
        <dependency>
            <groupId>se.thinkcode</groupId>
            <artifactId>calculator</artifactId>
            <version>1.0</version>
        </dependency>
    </dependencies>
</project>
It has a dependency to the production code so the test can get hold of the Calculator and get something to execute.
The result is a below:

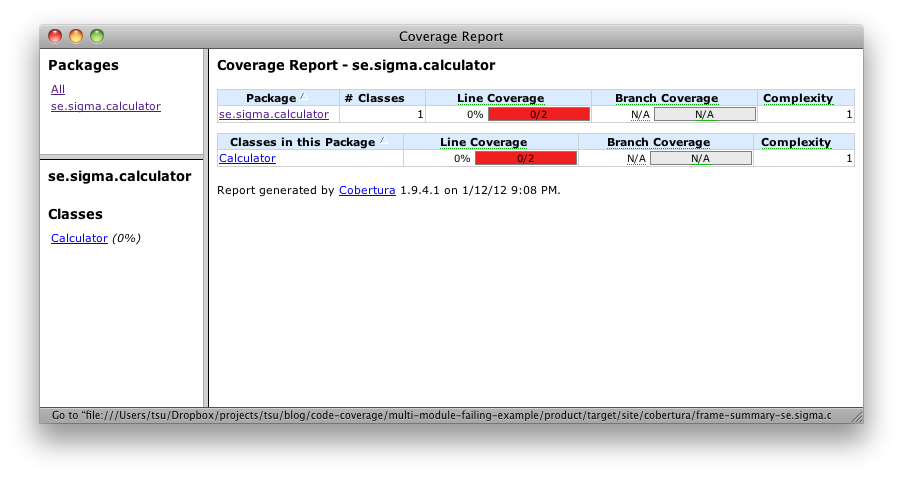
We see that we have 0% code coverage. Even though we know that we should have 100% in this case.
Drilling down into the package tells us the same thing, no execution of the code has been recorded.

Further drilling revels the Calculator class. We see that we had the possibility to run two lines. We also notice that Cobertura didn't record any execution of the code.

This is by design. The classes the test executes has not been instrumented yet.
A solution is to use a combination of tools. Maven and Ant in combination can solve this problem. Maven is great for compiling the classes and executing the tests. All issues with class path and similar are handled nicely by Maven. Ant is extremely flexible and can be used to instrument the compiled classes and then merge the result after executing the tests to a coverage report.
A working multiple Maven module example
The file layout in this example is the same as to the example above, with the exception that I have added an Ant build.xml into the mix.
multi-module-example
|-- build.xml
|-- pom.xml
|-- product
|   |-- pom.xml
|   `-- src
|       `-- main
|           `-- java
|               `-- se
|                   `-- sigma
|                       `-- calculator
|                           `-- Calculator.java
`-- test
    |-- pom.xml
    `-- src
        `-- test
            `-- java
                `-- se
                    `-- sigma
                        `-- calculator
                            `-- CalculatorTest.java
The execution has to be done in four steps.
- Compile all code
- Instrument the code
- Execute all tests
- Consolidate and build the report
It means that you have to execute the commands below in this order:
mvn clean compile
ant instrument
mvn test
ant report
The root pom is defined as below:
pom.xml
<?xml version="1.0" encoding="UTF-8"?>
<project>
    <modelVersion>4.0.0</modelVersion>
    <groupId>se.thinkcode</groupId>
    <artifactId>multi-module-example</artifactId>
    <version>1.1</version>
    <packaging>pom</packaging>
    <modules>
        <module>product</module>
        <module>test</module>
    </modules>
    <properties>
        <project.build.sourceEncoding>UTF-8</project.build.sourceEncoding>
        <project.reporting.outputEncoding>UTF-8</project.reporting.outputEncoding>
    </properties>
    <build>
        <plugins>
            <plugin>
                <groupId>org.apache.maven.plugins</groupId>
                <artifactId>maven-clean-plugin</artifactId>
                <version>2.4.1</version>
                <configuration>
                    <filesets>
                        <fileset>
                            <directory>.</directory>
                            <includes>
                                <include>**/*.ser</include>
                            </includes>
                        </fileset>
                    </filesets>
                </configuration>
            </plugin>
        </plugins>
    </build>
    <dependencies>
        <dependency>
            <groupId>junit</groupId>
            <artifactId>junit</artifactId>
            <version>4.10</version>
        </dependency>
    </dependencies>
</project>
It doesn't use any Cobertura plugin. The cobertura instrumentation and reporting will be done by the Ant script.
It uses the Maven Clean plugin to remove files Cobertura uses to store which lines has been executed. They are
called cobertura.ser as default. I add sum.ser in the Ant script and therefore I want to
remove all *.ser files from the project during the clean phase. This really doesn't matter for this example, it is
just house keeping.
The Ant build script is defined as:
build.xml
<project>
    <target name="instrument">
        <!-- Add all modules that should be included below -->
        <!-- <antcall target="instrumentAModule">
            <param name="module" value="MODULE_NAME_TO_REPLACE"/>
        </antcall> -->
        <antcall target="instrumentAModule">
            <param name="module" value="product"/>
        </antcall>
    </target>

    <target name="report" depends="merge">
        <property name="src.dir" value="src/main/java/"/>
        <cobertura-report datafile="sum.ser"
                          format="html"
                          destdir="./target/report">
            <!-- Add all modules that should be included below -->
            <!-- fileset dir="./MODULE_NAME_TO_REPLACE/${src.dir}"/ -->
            <fileset dir="./product/${src.dir}"/>
        </cobertura-report>
    </target>

    <target name="merge">
        <cobertura-merge datafile="sum.ser">
            <fileset dir=".">
                <include name="**/cobertura.ser"/>
            </fileset>
        </cobertura-merge>
    </target>

    <target name="instrumentAModule">
        <property name="classes.dir" value="target/classes"/>
        <cobertura-instrument todir="./${module}/${classes.dir}">
            <fileset dir="./${module}/target/classes">
                <include name="**/*.class"/>
            </fileset>
        </cobertura-instrument>
    </target>

    <property environment="env"/>
    <property name="COBERTURA_HOME" value="/Users/tsu/java/cobertura-1.9.4.1"/>
    <property name="cobertura.dir" value="${COBERTURA_HOME}"/>
    <path id="cobertura.classpath">
        <fileset dir="${cobertura.dir}">
            <include name="cobertura.jar"/>
            <include name="lib/**/*.jar"/>
        </fileset>
    </path>
    <taskdef classpathref="cobertura.classpath" resource="tasks.properties"/>
</project>
The two main targets to understand are
- instrument
- report
The instrument target will prepare the compiled classes with Cobertura instrumentation so they are able
to record their usage.
The report target is used to combine the result from the execution and build to coverage report.
To get this example up and running, you need to download Cobertura. I used the link http://cobertura.sourceforge.net/download.html and
downloaded the binary version of Cobertura 1.9.4.1. I unzipped the downloaded file into the directory /Users/tsu/java/cobertura-1.9.4.1
on my computer. You will ned to update the reference in the build.xml to match your specific location.
The production pom is identical to the production pom in the previous example, it doesn't know anything about code coverage or Cobertura.
product/pom.xml
<?xml version="1.0" encoding="UTF-8"?>
<project>
    <modelVersion>4.0.0</modelVersion>
    <parent>
        <groupId>se.thinkcode</groupId>
        <artifactId>multi-module-example</artifactId>
        <version>1.1</version>
    </parent>
    <groupId>se.thinkcode</groupId>
    <artifactId>calculator</artifactId>
    <version>1.1</version>
</project>
The test project is almost identical to the test module pom above.
test/pom.xml
<?xml version="1.0" encoding="UTF-8"?>
<project>
    <modelVersion>4.0.0</modelVersion>
    <parent>
        <groupId>se.thinkcode</groupId>
        <artifactId>multi-module-example</artifactId>
        <version>1.1</version>
    </parent>
    <groupId>se.thinkcode</groupId>
    <artifactId>calculator-test</artifactId>
    <version>1.1</version>
    <dependencies>
        <dependency>
            <groupId>se.thinkcode</groupId>
            <artifactId>calculator</artifactId>
            <version>1.1</version>
        </dependency>
        <dependency>
            <groupId>net.sourceforge.cobertura</groupId>
            <artifactId>cobertura</artifactId>
            <version>1.9.4.1</version>
        </dependency>
    </dependencies>
</project>
The test project need a dependency to the Cobertura plugin to be able to record the execution during the test phase. The production code has been instrumented to use Cobertura so it needs to be available in the test classpath.
Executing the commands
mvn clean compile
ant instrument
mvn test
ant report
should now create a report like this:

It tells us that we have been able to count the times all lines has been executed.
Drilling down into the package se.sigma.calculator will give you the view below:

Further drilling into the class Calculator will show each executed line of code.

That's it folks!
If the classes are properly instrumented before the test execution, then Cobertura will be able
to record the execution of each line and a coverage report is possible to compile afterwards.
Acknowledgements
This post has been reviewed by Malin Ekholm.
Thank you very much for your feedback!
Resources
- A bug report describing why we need to mix Ant into the coverage calculation
- Cobertura on Sourceforge
- Test coverage - friend or foe - a blog discussing the risk with measuring test coverage
- Thomas Sundberg - the author